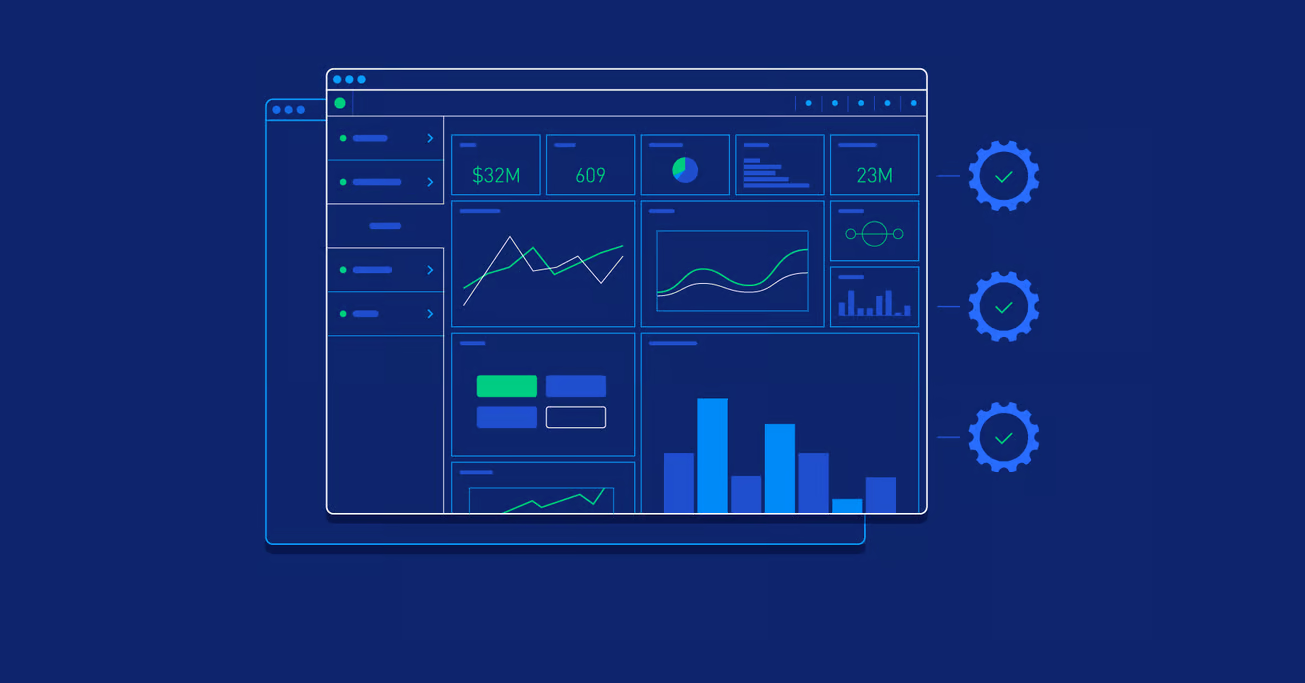
A dashboard is successful when it changes what someone does on Monday morning, not when it launches.
Start from a decision
For each dashboard, write one sentence: “This helps [role] decide [what] by showing [which measure].” If you cannot complete the sentence, the dashboard probably is not needed.
Fewer measures, clearer comparisons
- Lead with three to five measures that matter for the decision.
- Always show a comparisontarget, prior period or peer group.
- Use colour for exceptions, not decoration.
Build on a trusted model
Reports that each calculate their own revenue figure create arguments. Point every dashboard at the same governed model so a number means the same thing everywhere.
Make it easy to ask the next question
Good BI allows a user to move from the summary to the detail behind it in a click or two. Self-service works best when the underlying model is clean and the filters follow how people think about the business.
Support adoption
- Involve users while you design, not after you launch.
- Train by role, using their own data.
- Check usage monthly and retire what nobody opens.
Performance matters
A dashboard that takes half a minute to load will be abandoned. Aggregate heavy calculations upstream and keep visuals light.
Want to put this into practice?
Talk to our team about your data, planning and AI goals, or book a demo and see how it works on your own data.